What Is a Chart of Accounts?
A chart of accounts, or “COA”, organizes your business’s financial data. It serves as a blueprint for how financial data is recorded, categorized, and analyzed.
The structure of a COA is designed so that every transaction is recorded properly. This makes it easier to track, review, and report your financial activities.
However, do you really understand how a chart of accounts works? Which accounts should you use for your business finances?
This article explains these in order for you to understand them better. It explains what a chart of accounts means and why it’s important for your business. You will also get to understand the basic structures of a COA and learn how to create an account.
What Does a Chart of Accounts Mean and How Does It Work?
A chart of accounts is a list. It groups all business transactions and financial accounts. They use it to monitor their transactions. You can think of it as a detailed map that monitors your firm's financial activities. It groups the firm's finances into different basic forms. You can see where your firm's money comes from and where it goes.
This list of accounts is in the firm's general ledger. It supports your accounting system. So, whether your business is small or large, a COA is still needed. It organizes your financial information.
To better understand how a COA works, imagine looking at your personal finances. Let’s say you’re using an app to track all of your accounts. It can be your savings, checking or investments. Think of it as your personal COA. Your money is split into different categories. So, in business terms, this kind of setup allows accountants, managers, or even investors to quickly understand the company’s finances.
Why Is It Important?
Businesses need a chart of accounts for their transactions and financial reporting. It helps when preparing financial statements. It organizes all financial transactions clearly. This then supports your company’s budgeting, forecasting, and decision-making.
Larger businesses usually have more complex transactions. A COA then helps identify trends, boost efficiency, and reduce errors. This makes it easier for stakeholders like investors or managers to assess the company’s financial health.
Structure of a Chart of Accounts
A chart of accounts has 5 different structures to categorize a company’s finances. They include assets, liabilities, equity, income, and expenses. Each category has subcategories that help businesses track and analyze their finances better.
-
Assets
Your assets are everything your business owns or controls. They can bring value in the future. They can be cash, commodities that they sell, or materials that keep the business going. Assets can be grouped into:
-
Current Assets (Short-Term): These are items that your business can change into cash within a year or during its normal business cycle. Current assets include cash and bank account balances. They can also be accounts receivable, like money that customers owe the business. Current assets also include products or materials that the business sells and prepaid expenses. For example, insurance.
-
Non-Current Assets (Long-Term): These are assets that stay in the business for more than a year. You cannot easily change them into cash. Most of the time, they are used for your business’s operations and growth. Non-current assets can be buildings and land. Office equipment, furniture and machinery can also count as long-term assets, as well as intangible assets. Intangible assets include patents, trademarks, or software.
-
Liabilities
Liabilities are what the business owes. They refer to the debts that a business needs to settle. It includes money or goods that they owe. They are also divided into:
-
Current Liabilities: These are obligations a company has. Because they are current liabilities, they can be paid off within one year. Examples are accounts payable and short-term loans. They can be accrued expenses. These are payments you get for services or products not yet delivered.
-
Non-Current Liabilities: These refer to the debts that you don’t need to repay within the next 12 months. Examples are long-term loans, taxes you defer, ease and pension obligations.
-
Equity
Equity refers to the owner's interest. You can determine it after deducting the liabilities of a business from its assets. It shows how much of the business belongs to the owners or shareholders. Equity accounts usually include a company's stocks and its retained profits. Other examples also include paid-in capital or treasury stocks.
-
Income (Revenue)
Income is the money a business earns. It is the revenue from their operations. This can be from selling goods, offering services, or any other business activities. Your business income accounts help to evaluate how profitable the business is. It is divided into:
-
Operating Revenue: This is the money businesses make from selling or providing their services.
-
Non-operating revenue: Examples include the interest they earn from the business and the rental income.
-
Expenses
Expenses are the money you use to pay for things in the business. They are what is used to operate and generate revenue. They are usually grouped into:
-
Direct Expenses: These are the costs a business incurs to produce a product or provide a service. Examples include how much they spend on raw materials and production supplies.
-
Indirect Expenses: These are what businesses spend money on regularly. Examples are: salaries of employees and rent. It can also be used for utilities, ads, and marketing.
Chart of Accounts Example
Here’s a simple chart of accounts example for a small business:
Assets
1010 – Cash
1020 – Petty Cash
1030 – Accounts Receivable
1040 – Inventory
1050 – Prepaid Expenses
Liabilities
2010 – Accounts Payable
2020 – Credit Card Payable
2030 – Loan Payable
Equity
3010 – Owner’s Capital
3020 – Retained Earnings
Revenue
4010 – Sales
4020 – Interest Earned
5010 – Cost of Goods
Expenses
6010 – Rent
6020 – Salaries
6030 – Utilities
6040 – Advertising
Each of these numbers helps them track money in or out, making it easier to stay organized.
How To Create a Chart of Accounts

Below are the steps to prepare a chart of accounts for your business:
-
Know Your Business: First, watch how your business runs. That is, think about what you sell, how you make money, and what you spend on. This will help you choose account categories that fit your needs now and later.
-
Select a Numbering Scheme: Use a numbering scheme to categorize your accounts. Small businesses can just keep it simple, e.g., 1000, 1001. Large businesses may need more form. For example, 1010-01-00 suggests the type of account, department, and specific account. Here, 1010 is the type of account, 01 is the department, and 00 is the specific account.
-
Group Your Accounts: Group your accounts into assets, liabilities, equity, income, and expenses. Then, you'll have to classify each of these according to your business needs. Under assets, for example, you could have cash, inventory, and equipment.
-
Assign Account Numbers: Give each account a number based on your system. Begin with the broad categories, and then you can get more specific as you move.
-
Name and Describe Each Account: Give each account a clear name and a brief description. This helps you avoid any confusion, so you’ll know how to use them correctly. For instance, marketing expenses can include ads, branding, or digital promotions.
-
Set It Up and Update It: After you create your chart of accounts, enter it into your accounting software. Try to test it with a few transactions to make sure it works smoothly. Don’t forget to check it regularly, too.
In Summary
A good chart of accounts is important. It helps track a company’s finances and supports better decision-making. However, to get the most from your COA, you need to try to keep it simple and make it fit your business type. Use a logical numbering system, and make sure to group your accounts into their correct categories. Make sure that they’re clear and you understand them easily. Also, aligning your COA with standard accounting principles and integrating it with accounting software can make reporting and analysis much easier.
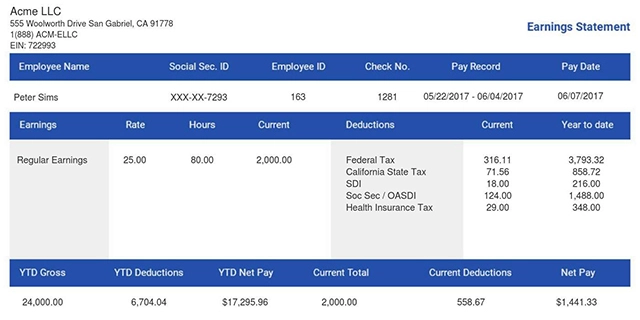
Generate your accurate pay stubs with our pay stub generator. A good COA helps you track business expenses. However, you still need your pay stub for easy payroll reporting. Try using our tool now!
- 1. Enter Your Information

- 2. Select Your Favorite Theme

- 3. Download Your Stub!